We are linking to the Alan W2AEW video above. Alan's YouTube channel is an excellent resource for ham radio, test and measurement, as well as other electronics knowledge. The video gave us the idea to check the CW keyer speeds on our most expensive rig and our lowest price rig. It seemed like a good excuse to use the Liquid Instruments Moku:Lab oscilloscope, plus we were curious.
----
We won't explain the method, Alan W2AEW does a great job with that in the video. One different is we used the audio output for our delta(t) measurement.
-----
Here are our results:
We haven't seen the same RBN vs. Rig WPM speed different as Alan pointed out and the table helps explain why. Sure, the numbers are 'off' at the 25WPM test, but we seldom operate at those CW speeds.
We found this ~60 year old Biddle Megger while going through the closet. It was used by my father's and was no longer working. The fix was possibly something simple, but we don't need a Megger so the crank voltage transformer became more interesting.
-----
Just for the heck of it we decided to mount the crank voltage transformer and discover what it could still do.
We knew based on the dial setting on the Megger that an output of ~1000 Volts AC was possible. To not cook any of our instruments during the test we built 100K:1K Ohm resistive divider to tame the signal. This makes the amplitude of the crank voltage transformer output about 100 times smaller.
Here the results using the Moku:Lab as our measurement tool. This was easy duty for the Moku which has an 13 amazing instruments in one box and worth reading about.
----
Turning the crank as slow as we could yielded about ~480V RMS at 13Hz. Touching the output terminals not was screamingly painful, but we did verify that it is uncomfortable to touch.
----
Max output was ~800V RMS at 55Hz and we wisely decided not to sample the pain level of this output.
When our FlexRadio is not being used it really should do 'something'. We typically put it in a WSPR spotting mode via WSJT-X, but sometimes we forget. This short simple Python script takes care of that.
----
FlexRadio has an open API and we could have just used it to accomplish the project. However, there are two wonderful (and free) programs that are always open on the PC running the FlexRadio SmartSDR software that make things easier; FRStack and Slice Master. In this project we use FRStack for API calls and Slice Master to automatically launch WSJT-X. NOTE: We use FRStack and Slice Master for other features as well. IMO they are must have programs to make your Flex more flexible.
-----
The Python script listed below looks at user defined intervals (in the example it is every 30 minutes) to see if any settings on the rig have changed. If a setting has changed (frequency, band, mode, volume, filters, etc. etc. etc...) the program assumes the rig is in use and just waits for the next check interval.
-----
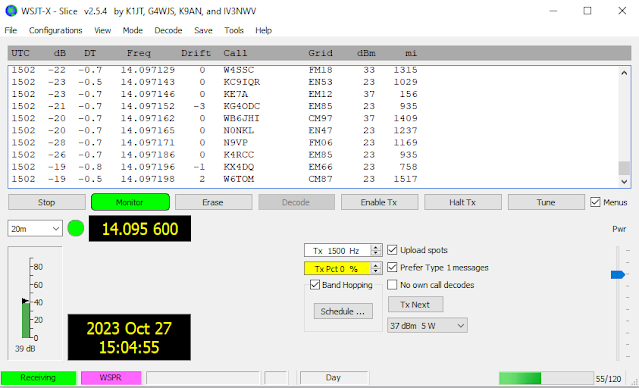
If the time interval expires and no settings have been changed the program assumes the rig is idle and switches it to DIGU mode.
Slice Master takes that switch to DIGU mode as a trigger to launch WSJT-X and start doing WSPR stuff.
-----
# auto_wspr.py OCT2023 # # Python script to make the Flex Radio switch to WSPR mode when idle. # # Written by: WhiskeyTangoHotel.Com # # Leverages the auto LAUNCH feature of "Slice Master". # https://github.com/K1DBO/slice-master-6000 # # Leverages WSJT-X for TX/Rx spotting # https://wsjt.sourceforge.io/wsjtx.html # # Leverages FRStack # https://www.mkcmsoftware.com/download/FRStackWebApiReadme.html#apis
import requests import urllib.request import time
# Set idle_max to the number of minutes between checks to see if any rig settings have changed. # If idle rig then switch to DIGU mode. DIGU mode will trigger Slice Master to start WSJT-X.
idle_max = 60 # in minutes, How ofen to check to see if the rig is idle.
last_status = 'First_run' mode = ' '
#print ( 'Entering endless loop.....' ) while True: print ('Checking for rig activity every' , idle_max , 'minutes.') print ('---------------------------------------------------')
# If rig is in DIGU mode then do nothing. We are already running WXJT response = requests.get('http://localhost:13522/api/ActiveSlice/MODE?') response = response.text mode = response #print ('MODE is:' , response)
if response == '"DIGU"': print ('Rig in DIGU mode. Do nothing.') else: # not in DIGU mode. Have rig settings changed or is it idle? response = requests.get('http://localhost:13522/api/ActiveSlice/INFO?') current_status = response.text if last_status != current_status: print ('Rig in use. Do not change to DIGU. Do not launch WSJT')
The Pimoroni Galactic Unicorn is a cool piece of kit that we have had our eye on for a while. The item is popular and sells out quickly, but we finally got our hands on one. Summary: It's awesome! After the initial "WOW!" factor diminished we went in search of a project for it.
-----
The answer was obvious. How many times are you sitting comfortably in your home theater room with the family and you miss a Morse Code CQ from one of your ham radio friends? That's what we thought, so we set out to solve that inconvenient and irritating problem!
- Create a HamAlert account and set up some triggers for the ham operators of interest. You will need to select the "telnet" reporting option in the trigger menu.
- Copy/Paste our MicroPython source code below into the Pimoroni Galactic Unicorn. We used Thonny as our development environment. Name the program "main.py" so it will autostart at bootup.
- Place the rig under that big screen TV in the home theater room. Simply wait for your movie or favorite show to be interrupted letting you know it's time to drop everything and fire up your ham radio for a QSO!
-----
Here is a live demo of the setup. What happens is:
- K5JM, who is in my HamAlert triggers is spotted calling CQ.
- We parse the response of the HamAlert telnet server and display the information we want on the LED matrix.
- Of course, we answer K5JM. Success!!! Next we return to the home theater room and await the next interruption.
-----
Source code below:
''' Morse Alert MAY2023 WhiskeyTangoHotel.Com
This program displays your individual hamalert.org telnet CW triggers onto the display of the Raspberry PI PicoW based Pimoroni Galactic Unicorn. Thanks HamAlert.Org by Manuel Kasper (HB9DQM) for their telnet service!
CW CQ info shown is "Callsign", "Frequency", and "WPM", but other options are available. The text is color coded by band. Scroll speed and total display variables are adjustable. Alert 'chirp' is adjustable.
A CW beacon, such as WR5U which transmits about every 30 minutes, may be a suggested hamalert telnet trigger to avoid timeouts from the hamalert.org server.
NOTE: Does not work with hamalert.org simulated triggers
'''
#Variable set up: wifi_ssid = "wifi_ssid" wifi_password = "wifi_password"
# hamalert.org login info username = "telnet_username" password = "telnet_passord" telnetaddr = "hamalert.org" # "telnetaddress.com" port = 7300 # port as a number, not a string
from galactic import GalacticUnicorn gu = GalacticUnicorn()
# Set up speaker for a sweeping 'chirp' alert volume = .5 # range is 0 to 1. 0 = For no sound start_tone = 500 #500 is a good start Adjust to suit. end_tone = 1000 #1000 is a good start. Adjust to suit. channels = [gu.synth_channel(i) for i in range(1)]
waitmsg = "HamAlert..." howbright = 0.1 # value range 0.0 to 1.0 dwelltime = 5 # how many seconds to display Callsign, Freq, WPM tot_time = 60 # how long (seconds) to cycle this info
utc_offset = -5 # we print to screen (not to LEDs the zulu and local time)
import network import usocket as socket import time import utime
from picographics import PicoGraphics, DISPLAY_GALACTIC_UNICORN graphics = PicoGraphics(display=DISPLAY_GALACTIC_UNICORN)
#Define some colours BLACK = graphics.create_pen(0, 0, 0) RED = graphics.create_pen(255, 0, 0) YELLOW = graphics.create_pen(255, 255, 0) GREEN = graphics.create_pen(0, 255, 0) CYAN = graphics.create_pen(0, 255, 255) BLUE = graphics.create_pen(0, 0, 255) MAGENTA = graphics.create_pen(255, 0, 255) WHITE = graphics.create_pen(200, 200, 200) GREY = graphics.create_pen(100, 100, 100) DRKGRY = graphics.create_pen(50, 50, 50) FREQCOLOR = WHITE # this is the text color that will change per band waitmsgcolor = GREY # number, not a string
# create a PicoGraphics framebuffer to draw into graphics = PicoGraphics(display=DISPLAY_GALACTIC_UNICORN) gu.set_brightness(howbright)
#Create a single wlan object and use as a global for all net calls wlan = network.WLAN(network.STA_IF)
# Wait for connect success or failure max_wait = 100 while max_wait > 0: if wlan.status() < 0 or wlan.status() >= 3: break max_wait -= 1 wifistat = 'WiFi...' + str(100-max_wait) if max_wait == 0: wifistat = "WiFi fail" print(wifistat) width = graphics.measure_text(wifistat, 1) startplace = int(float(GalacticUnicorn.WIDTH) - width) / 2 # clear the graphics object graphics.set_pen(BLACK) graphics.clear() # draw the text graphics.set_pen(waitmsgcolor) graphics.text(wifistat, round(startplace), 2, -1, 0.55); # update the display gu.update(graphics) time.sleep(.5)
if max_wait > 0: print("WIFI OK!") width = graphics.measure_text('WIFI OK!', 1) startplace = int(float(GalacticUnicorn.WIDTH) - width) / 2 # clear the graphics object graphics.set_pen(BLACK) graphics.clear() # draw the text graphics.set_pen(waitmsgcolor) graphics.text('WIFI OK!', round(startplace), 2, -1, 0.55); # update the display gu.update(graphics) time.sleep(5)
# Connect to the telnet server tn = socket.socket() addr = socket.getaddrinfo(telnetaddr, port)[0][-1] tn.connect(addr)
# Log in with the username and password to telnet server tn.send(username + "\r\n") tn.send(password + "\r\n")
last_spot = utime.time() # we track/print time between spots
# Read and process the telnet server response while True: data = tn.recv(1024) data = data.decode("utf-8") print(data)
# Center "waitmsg" width = graphics.measure_text(waitmsg, 1) startplace = int(float(GalacticUnicorn.WIDTH) - width) / 2 # clear the graphics object graphics.set_pen(BLACK) graphics.clear() # draw the text graphics.set_pen(waitmsgcolor) graphics.text(waitmsg, round(startplace), 2, -1, 0.55); # update the display gu.update(graphics)
# Play 'connected' Chirp alert for tone in range(start_tone, end_tone): channels[0].play_tone(tone, volume) gu.play_synth() time.sleep(.0009) gu.stop_playing()
if "DX de" in data: #print(data)
# Split the string into a list of values data_list = data.split()
# Assign each value to separate variables dx = data_list[0] de = data_list[1] spotter = data_list[2] freq = data_list[3] spotted = data_list[4] db = data_list[5] wpm = data_list[6] zulu = data_list[7]
# Print the values of the variables print("HamAlert returns:") #print('dx:', dx ) #print('de:', de) #print('spotter:', spotter) print('Freq:', freq) print('Spotted:', spotted) #print('db:', db) print('WPM:', wpm) #print('zulu:', zulu)
#Convert zulu to local hours = int(zulu[:2]) minutes = int(zulu[2:4]) local_hours = hours + utc_offset local_minutes = minutes # If negative hour fix wraparound if local_hours < 0: local_hours += 24 # Format to local timeg local_time = "{:02d}:{:02d}".format(local_hours, local_minutes) print('Local time:', local_time) #print('Minutes last spot:', int( (utime.time() - last_spot)/ 60) ) last_spot = utime.time() # we track/print time between spots print('-------------------') print
FREQCOLOR = WHITE band = float(freq) if 24890 <= band <= 24990: FREQCOLOR = CYAN # text color for 12 meter spots if 18068 <= band <= 18168: FREQCOLOR = BLUE # text color for 17 meter spots if 14000 <= band <= 14350: FREQCOLOR = MAGENTA # text color for 20 meter spots if 10100 <= band <= 10150: FREQCOLOR = RED # text color for 30 meter spots if 7000 <= band <= 7300: FREQCOLOR = YELLOW # text color for 40 meter spots if 3500 <= band <= 4000: FREQCOLOR = GREEN # text color for 80 meter spots
for x in range(0, int((tot_time/(dwelltime*3)))): # Center position of the text width = graphics.measure_text(spotted, 1) startplace = int(float(GalacticUnicorn.WIDTH) - width) / 2 # clear the graphics object graphics.set_pen(BLACK) graphics.clear() # draw the text graphics.set_pen(FREQCOLOR) graphics.text(spotted, round(startplace), 2, -1, 0.55); # update the display gu.update(graphics) time.sleep(dwelltime)
# Center position of the text width = graphics.measure_text(freq, 1) startplace = int(float(GalacticUnicorn.WIDTH) - width) / 2 # clear the graphics object graphics.set_pen(BLACK) graphics.clear() # draw the text graphics.set_pen(FREQCOLOR) graphics.text(freq, round(startplace), 2, -1, 0.55); # update the display gu.update(graphics) time.sleep(dwelltime)
# Center position of the text width = graphics.measure_text(wpm, 1) startplace = int(float(GalacticUnicorn.WIDTH) - width) / 2 # clear the graphics object graphics.set_pen(BLACK) graphics.clear() # draw the text graphics.set_pen(FREQCOLOR) graphics.text(wpm, round(startplace), 2, -1, 0.55); # update the display gu.update(graphics) time.sleep(dwelltime)
#print(waitmsg)
# Below if you want time of last spot shown. This can help ID a telnet timeout. # See our reason for having a CW beacon comment at the very top. waitmsg = 'Last ' + local_time
# This if you want the your pre-defined waitmsg after a spot #width = graphics.measure_text(waitmsg, 1)
width = graphics.measure_text(waitmsg, 1) startplace = int(float(GalacticUnicorn.WIDTH) - width) / 2 # clear the graphics object graphics.set_pen(BLACK) graphics.clear() # draw the text graphics.set_pen(waitmsgcolor) graphics.text(waitmsg, round(startplace), 2, -1, 0.55); # update the display gu.update(graphics) -----
We saw this Elitech RC-5+ Temperature Data Logger at Amazon for $19.95 USD. The specs looked great and for the price we just had to give a try. We were not disappointed.
The ElitechLog software is a free download and provides easy to view graphs and stats on the gathered data. Just to do 'something' with the unit we placed it in our refrigerator overnight in various locations. Below are the overnight averages:
-----
Here is a temperature graph taken over a 20 hour time period and a data point every 60 seconds.
-----
More equally useless projects come to mind and we will post the them below as they happen. In the end this is a great value and a useful tool.
-----
After getting a new LG refrigerator we reran the experiment (NOV2023):